

Google have always said they’re fixing the fragmentation issue of its mobile operating system. But from what it looks like, the company is still failing to do so.
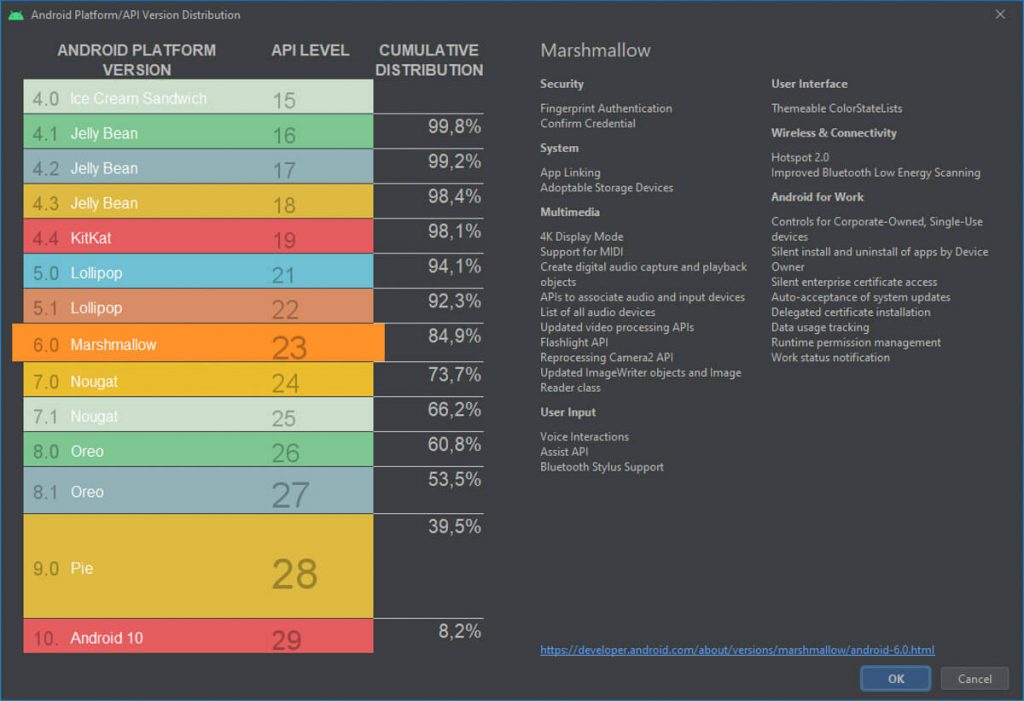
In fact, Google has complete taken down the Android distribution chart after not updating it for nearly a year. The chart basically shows how many devices are running every Android version that came out — up to the latest Android 10 version. If the figures for 10 is bad, just imagine how it is for Android 11.

The chart will help app developers to see that Android versions are most used on smartphones for them to tailor their apps on.
That’s why the graph is now only accessible via Android Studio, a program designed for Android developers. The company might be hiding it to the general public, but at least the people who actually need it can get access.
So, what is Google’s reason from hiding the chart? We might have a clue.
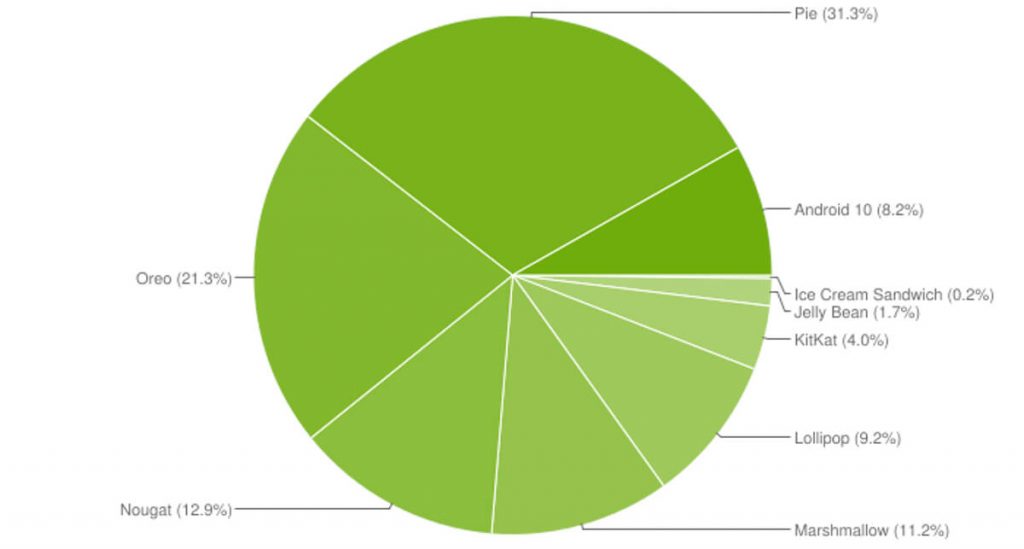
From what it looks like, the Android 10 adaptation is slower than the Android 9 Pie. There are only 8.2% of Android smartphones running Android 10. Meanwhile, its predecessor managed to have 10.4% share by May of last year.
We’re still a few weeks away until May arrives. But despite that, we don’t expect Android 10 to surpass Android Pie’s achievements. Especially with the COVID-19 pandemic disrupting the sales of newer smartphones equipped with Android 10.
But despite that, the Android 10 could have reached those numbers if older smartphones were updated to this latest version. As you can see, Android Pie now dominates the Pie chart (pun intended) with a 31.3% share.
You can also notice that a lot of Android phones are still running older versions such as Android Oreo and Nougat, which goes to show that the Android fragmentation if far from being fixed. Although, a lot of brands have already committed Android 10 updates on some of their devices, you can check their respective schedules here.
Google Fuschia was meant to end Android’s fragmentation problem, but it looks like it won’t be out anytime soon.